Laundromat Operating Costs in Sydney: Utilities at 25–35% of P&L
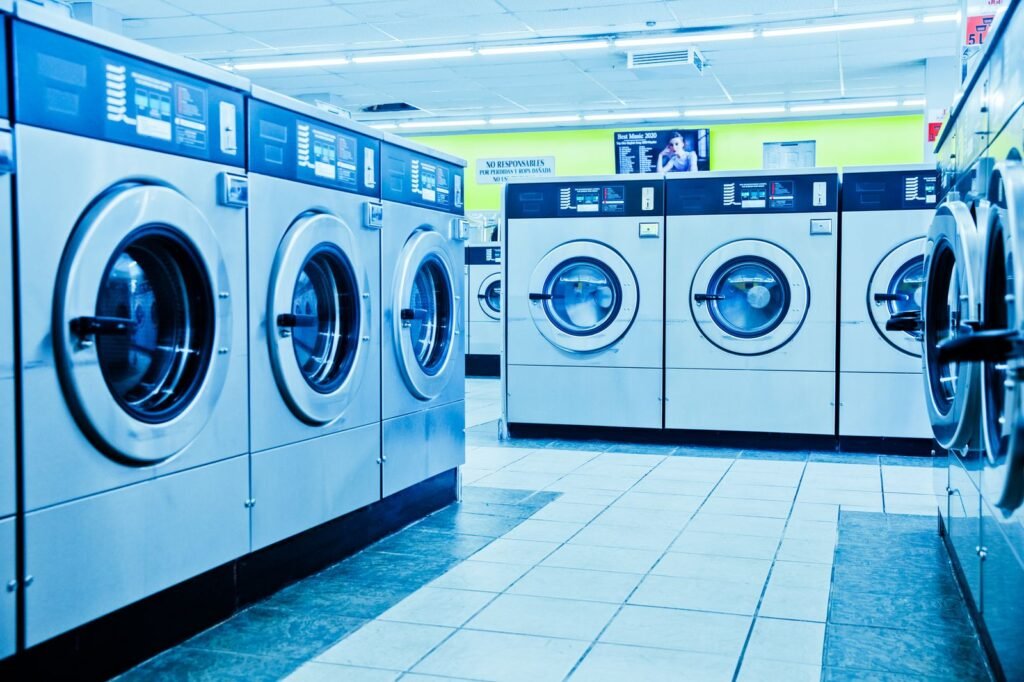
Laundromat operating costs Sydney models commonly allocate roughly 25% to 35% of operating costs to utilities, with electricity dominating because of dryers and water heating. Updated 26 June 2026.
Industry P&L benchmarks from laundromat financial modelling platforms such as ScaleSuite, cited in operator forums and franchise disclosure materials, consistently show utilities as the largest variable cost line after rent for coin and hybrid stores. Falling DMO benchmarks from 1 July 2026 offer partial relief but don’t replace load management.
This article connects Sydney cost structure to the AER news cycle so owners translate policy headlines into margin maths.
Typical Sydney cost stack
Rent and occupancy commonly lead fixed costs in inner suburbs. Utilities follow closely for high-turnover stores with older dryer fleets. Labour sits lower in unmanned coin laundries but rises for attended sites with fold-and-drop shops.
Maintenance, card-system fees, insurance and marketing fill out remaining OPEX. Utilities near one-third of OPEX mean a 10% cut in kWh price moves total margin noticeably.
Why electricity dominates utilities
Tumble dryers draw sustained load. Electric water heating adds baseload. Lighting and HVAC matter but rarely exceed dryer share unless a site runs heat pump washers with gas backup.
AER’s DMO 8 small business reductions between 6.8% and 11.3% on flat rates, with deeper TOU savings in some NSW zones per EnergyPlans, interact directly with this cost line.
Sydney network specifics
Most Sydney laundromats sit on Ausgrid or Endeavour Energy distribution zones with different DMO reference numbers. Essential Energy applies west of the divide. Confirm your zone before benchmarking.
Time-of-use spreads tend to reward stores that can promote off-peak drying or extended late-night trade when residential peak passes.
Compare nearby operators via our locations directory.
Levers beyond waiting for DMO
High-efficiency dryers, moisture sensors, solar PV with cautious battery sizing, and LED retrofits attack the numerator while tariffs attack the rate. Sub-metre before and after upgrades to prove savings to investors.
Water price rises in some councils affect total utility share even when electricity headlines improve.
New store feasibility in 2026
Developers modelling Sydney acquisitions should stress-test utilities at both pre- and post-July 2026 rates plus a sensitivity case if gas or peak TOU spikes return in 2027. Single-year DMO relief isn’t a decade forecast.
Customer pricing caution
Don’t assume lower benchmarks automatically justify cutting vend prices. Competition and rent inflation can absorb utility savings. Track net margin per turn, not kWh alone.
Benchmarking against other Sydney operators
Utility share varies with store format. Unmanned coin laundries with older electric dryer banks sit at the top of the 25% to 35% utility band. Hybrid stores with wash-and-fold staff add labour but can run more efficient commercial machines with better moisture control.
Leak taps, failing extractor fans and thermostats fighting open doors inflate bills independent of tariff news. Maintenance deferred during tight cash months commonly shows up later as kWh spikes. Track litres per wash and dryer consumption per kg when possible, not only dollars per bill.
Planning 2026 capex with utility trends
If DMO 8 trims your effective rate modestly, reinvest savings into dryer replacements with shorter cycles rather than racing competitors on vend price alone. Sub-metre before and after upgrades to prove ROI to landlords or franchise partners.
More operating cost context lives on the blog, including DMO and TOU explainers tied to July 2026 benchmarks.
Rent reviews and card fees
Sydney landlords sometimes reset rents when tenants report lower utility benchmarks in the news. Understand your lease before assuming DMO relief flows straight to net margin.
Customers increasingly pay by card or app, adding merchant fees on each cycle. Utility savings from DMO 8 can offset card costs rather than funding vend cuts. Model margin per turn including payment fees, not electricity alone.
Frequently Asked Questions
What share of costs are utilities for Sydney laundromats?
Industry P&L models commonly place utilities at about 25% to 35% of operating costs, with electricity the largest component.
Will DMO 8 cut my Sydney laundry utility line by 11%?
Only if you’re on affected standing offers or renew onto competitive rates near the new benchmark. Actual savings depend on tariff type and usage profile.
Where can I find Sydney laundromats for comparison?
Use our locations directory to compare services and hours across Sydney suburbs.
Sources: EnergyPlans · AER
By Laundry Services Near Me Team
Need a local listing?
Browse verified businesses in our directory or read more guides on the blog.
Find laundromats All guides